Visualize your data structures!
This page contains the materials for my talk “Visualize your data structures!”.
Older videos
- ScalaDays Chicago, April 2017: https://www.youtube.com/watch?v=6mWaqGHeg3g
You can use this page in two ways:
- as a reference/refresher on the material covered in the talk;
- as an interactive playground where you can try the same commands I presented.
Throughout this page we will assume the following declarations (each section might add its own):
import reftree.core._
import reftree.diagram._
import reftree.render._
import reftree.geometry._
import reftree.svg.animation.Frame
import reftree.svg.XmlSvgApi
import reftree.svg.XmlSvgApi.svgUnzip
import reftree.contrib.XmlInstances._
import reftree.contrib.OpticInstances._
import reftree.contrib.ZipperInstances._
import reftree.contrib.ShapelessInstances._
import reftree.util.Optics
import reftree.demo.Data
import reftree.demo.Shortcuts
import scala.collection.immutable._
import java.nio.file.Paths
import Diagram.{sourceCodeCaption => diagram}
To start an interactive session, just run
$ sbt demo
@ render(List(1, 2, 3))
and open diagram.png in your favorite image viewer (hopefully one that
reloads images automatically on file change). You will also need to have
GraphViz installed. The interactive session
already has all the necessary imports in scope.
Introducing reftree
// extra declarations for this section
val renderer = Renderer(
  renderingOptions = RenderingOptions(density = 100),
  directory = Paths.get(ImagePath, "visualize")
)
import renderer._
reftree is a library for visualizing Scala data structures.
Let’s look at a quick usage example:
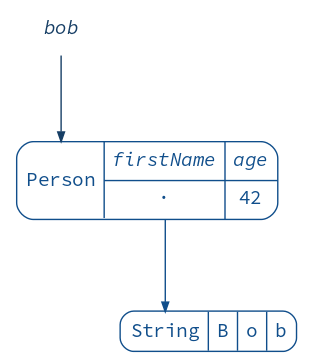
case class Person(firstName: String, age: Int)

val bob = Person("Bob", 42)
// bob: Person = Person(firstName = "Bob", age = 42)

diagram(bob).render("bob")
That’s it! You can configure the visualization as you like:
// render strings as a single box
import reftree.contrib.SimplifiedInstances.string
// rename the firstName field (pun not intended)
implicit val personConfig: ToRefTree.DerivationConfig[Person] =
  ToRefTree.DerivationConfig[Person]
    .tweakField("firstName", _.withName("name"))

diagram(bob).render("bob-simplified")

There are various ways you can use reftree:
- improving the documentation of your projects;
- live-coding demos;
- exploring how things work;
- anywhere you need diagrams of your Scala data structures.
(Incidentally, this talk is an example of all of the above.)
My previous reftree-powered talk focused on
immutable data and various ways it can be manipulated (I do recommend it).
Today I would like to take you on a journey deep inside reftree itself,
so that we can see how some of these techniques and concepts can be applied...
to produce visualizations of themselves — using one of my favorite reftree
features: animations.
Animation
  .startWith(Queue(1, 2, 3))
  .repeat(3)(_.iterate(2)(q => q :+ (q.max + 1)).iterate(2)(_.tail))
  .build(Diagram.toStringCaption(_).withAnchor("queue"))
  .render("queue")
Inside reftree
// extra declarations for this section
import reftree.contrib.SimplifiedInstances.{option, seq, list}
First, we need to grasp the basics of reftree.
To visualize a value of some type A, reftree converts it into a data structure
called RefTree (surprise!), using a typeclass ToRefTree[A].
For case classes this is done automagically, using
shapeless.
(If you are curious about the magic, take a look at this file.)
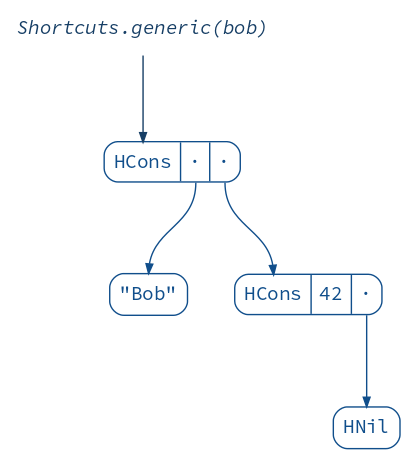
Given our friend bob, shapeless would provide a generic representation,
which includes the field names (at the type level!) and the values (as a heterogeneous list):
Shortcuts.generic(bob)
// res2: shapeless.::[String with shapeless.labelled.KeyTag[Symbol with shapeless.tag.Tagged["firstName"], String], shapeless.::[Int with shapeless.labelled.KeyTag[Symbol with shapeless.tag.Tagged["age"], Int], shapeless.HNil]] = "Bob" :: 42 :: HNil

diagram(Shortcuts.generic(bob)).render("generic")
This information is enough to auto-generate a RefTree.
Now, what does it look like? The best way to find out is to visualize a RefTree
of a RefTree!
diagram(Shortcuts.refTree(bob)).render("reftree")
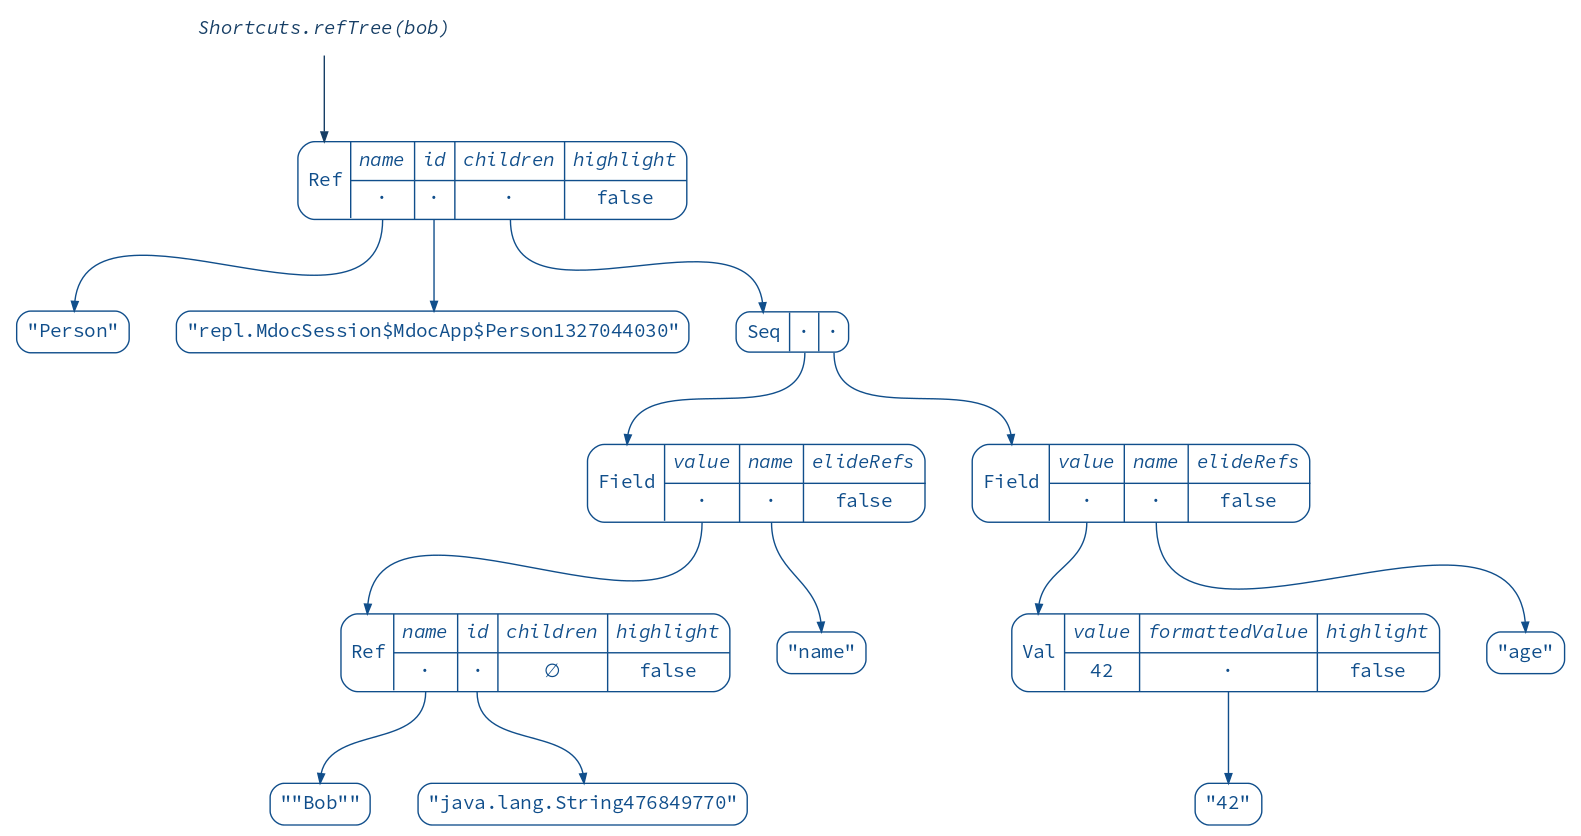
As you can see, it contains values (Val) and references (Ref).
How do we get from RefTree to an image though?
This is where GraphViz comes in.
From a RefTree we can obtain a graph definition that can be rendered by GraphViz:
Shortcuts.graph(bob).encode
// res5: String = """digraph "Diagram" {
// graph [ ranksep=0.8 bgcolor="#ffffff00" ]
// node [ shape="plaintext" fontname="Source Code Pro" fontcolor="#000000ff" ]
// edge [ arrowsize=0.7 color="#000000ff" ]
// "-repl.MdocSession$MdocApp$Person1327044030" [ id="-repl.MdocSession$MdocApp$Person1327044030" label=<<table cellspacing="0" cellpadding="6" cellborder="0" columns="*" bgcolor="#ffffff00" style="rounded"><tr><td port="n" rowspan="2">Person</td><td bgcolor="#ffffff00"><i>name</i></td><td bgcolor="#ffffff00"><i>age</i></td></tr><hr/><tr><td port="0" bgcolor="#ffffff00">·</td><td bgcolor="#ffffff00">42</td></tr></table>> ] [ color="#104e8bff" fontcolor="#104e8bff" ]
// "-java.lang.String476849770" [ id="-java.lang.String476849770" label=<<table cellspacing="0" cellpadding="6" cellborder="0" columns="*" bgcolor="#ffffff00" style="rounded"><tr><td port="n" rowspan="2">"Bob"</td></tr></table>> ] [ color="#104e8bff" fontcolor="#104e8bff" ]
// "-repl.MdocSession$MdocApp$Person1327044030":"0":"s" -> "-java.lang.String476849770":"n":"n" [ id="-repl.MdocSession$MdocApp$Person1327044030-0-java.lang.String476849770" ] [ color="#104e8bff" ]
// }"""
Going even further, we can ask GraphViz for an SVG output:
Shortcuts.svg(bob)
// res6: xml.Node = <svg width="171pt" height="168pt" viewBox="0.00 0.00 171.00 168.00" xmlns="http://www.w3.org/2000/svg" xmlns:xlink="http://www.w3.org/1999/xlink"><g id="graph0" class="graph"><title>Diagram</title><polygon fill="transparent" stroke="transparent" points="-4,4 -4,-164 167,-164 167,4 -4,4"/><!-- -repl.MdocSession$MdocApp$Person1327044030 --><g id="-repl.MdocSession$MdocApp$Person1327044030" class="node"><title>-repl.MdocSession$MdocApp$Person1327044030</title><path fill="transparent" stroke="transparent" d="M20,-100C20,-100 143,-100 143,-100 149,-100 155,-106 155,-112 155,-112 155,-144 155,-144 155,-150 149,-156 143,-156 143,-156 20,-156 20,-156 14,-156 8,-150 8,-144 8,-144 8,-112 8,-112 8,-106 14,-100 20,-100"/><text text-anchor="start" x="15.5" y="-124.3" font-family="Source Code Pro" font-size="14.00" fill="#104e8b">Person</text><polygon fill="transparent" stroke="transparent" points="71.5,-128 71.5,-155 117.5,-155 117.5,-128 71.5,-128"/><text text-anchor="start" x="77.5" y="-138.8" font-family="Source Code Pro" font-style="italic" font-size="14.00" fill="#104e8b">name</text><polygon fill="transparent" stroke="transparent" points="117.5,-128 117.5,-155 154.5,-155 154.5,-128 117.5,-128"/><text text-anchor="start" x="123.5" y="-138.8" font-family="Source Code Pro" font-style="italic" font-size="14.00" fill="#104e8b">age</text><polygon fill="transparent" stroke="transparent" points="71.5,-101 71.5,-128 117.5,-128 117.5,-101 71.5,-101"/><text text-anchor="start" x="90" y="-110.8" font-family="Source Code Pro" font-size="14.00" fill="#104e8b">·</text><polygon fill="transparent" stroke="transparent" points="117.5,-101 117.5,-128 154.5,-128 154.5,-101 117.5,-101"/><text text-anchor="start" x="127.5" y="-110.8" font-family="Source Code Pro" font-size="14.00" fill="#104e8b">42</text><polygon fill="#104e8b" stroke="#104e8b" points="71.5,-101 71.5,-156 71.5,-156 71.5,-101 71.5,-101"/><polygon fill="#104e8b" stroke="#104e8b" points="117.5,-128 117.5,-156 117.5,-156 117.5,-128 117.5,-128"/><polygon fill="#104e8b" stroke="#104e8b" points="71.5,-128 71.5,-128 117.5,-128 117.5,-128 71.5,-128"/><polygon fill="#104e8b" stroke="#104e8b" points="117.5,-128 117.5,-128 155.5,-128 155.5,-128 117.5,-128"/><polygon fill="#104e8b" stroke="#104e8b" points="117.5,-100 117.5,-128 117.5,-128 117.5,-100 117.5,-100"/><path fill="none" stroke="#104e8b" d="M20,-100C20,-100 143,-100 143,-100 149,-100 155,-106 155,-112 155,-112 155,-144 155,-144 155,-150 149,-156 143,-156 143,-156 20,-156 20,-156 14,-156 8,-150 8,-144 8,-144 8,-112 8,-112 8,-106 14,-100 20,-100"/></g><!-- -java.lang.String476849770 --><g id="-java.lang.String476849770" class="node"><title>-java.lang.String476849770</title><path fill="transparent" stroke="transparent" d="M76.5,-4C76.5,-4 112.5,-4 112.5,-4 117.5,-4 122.5,-9 122.5,-14 122.5,-14 122.5,-24 122.5,-24 122.5,-29 117.5,-34 112.5,-34 112.5,-34 76.5,-34 76.5,-34 71.5,-34 66.5,-29 66.5,-24 66.5,-24 66.5,-14 66.5,-14 66.5,-9 71.5,-4 76.5,-4"/><text text-anchor="start" x="73.5" y="-15.3" font-family="Source Code Pro" font-size="14.00" fill="#104e8b">"Bob"</text><path fill="none" stroke="#104e8b" d="M76.5,-4C76.5,-4 112.5,-4 112.5,-4 117.5,-4 122.5,-9 122.5,-14 122.5,-14 122.5,-24 122.5,-24 122.5,-29 117.5,-34 112.5,-34 112.5,-34 76.5,-34 76.5,-34 71.5,-34 66.5,-29 66.5,-24 66.5,-24 66.5,-14 66.5,-14 66.5,-9 71.5,-4 76.5,-4"/></g><!-- -repl.MdocSession$MdocApp$Person1327044030->-java.lang.String476849770 --><g id="-repl.MdocSession$MdocApp$Person1327044030-0-java.lang.String476849770" class="edge"><title>-repl.MdocSession$MdocApp$Person1327044030:s->-java.lang.String476849770:n</title><path fill="none" stroke="#104e8b" d="M94.5,-100C94.5,-73.19 94.5,-64.76 94.5,-41.1"/><polygon fill="#104e8b" stroke="#104e8b" points="96.95,-41 94.5,-34 92.05,-41 96.95,-41"/></g></g></svg>
At this point you might be guessing how we can use this as a basis for our animation approach. Every state of a data structure will be a separate frame in the SVG format. However, an animation consisting of these frames alone would be too jumpy. We need to add intermediate frames to smoothly “morph” one frame into another. With SVG being a vector format, this sounds simple. We just have to individually morph different aspects of the image:
- graph node positions;
- graph edges and their shapes;
- colors;
- stroke thickness;
- transparency.
Ouch! A sane functional approach would definitely help here :)
Functional animation
Let’s start by introducing an abstraction for morphing, or, in other words,
interpolating things of type A:
trait Interpolation[A] {
  def apply(left: A, right: A, time: Double): A
  def sample(left: A, right: A, n: Int, inclusive: Boolean = true): Seq[A]
}
(If you are curious, here is the actual implementation.)
Once we have an instance of Interpolation[xml.Node], we can generate
as many intermediate frames as we want! But how do we construct this instance?
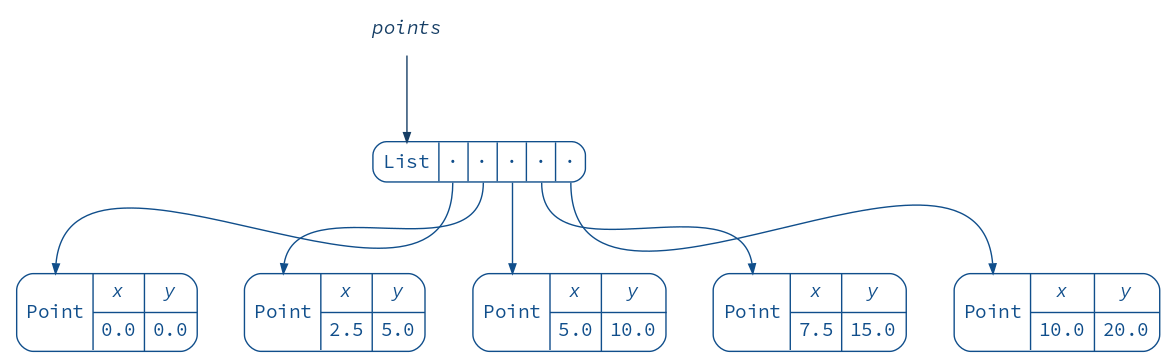
Consider a lowly floating point number (it can represent an x coordinate of some element in our SVG, for example).
There is an obvious way to implement Interpolation[Double], which reftree already defines as Interpolation.double:
val numbers = Interpolation.double.sample(0, 10, 5).toList
// numbers: List[Double] = List(0.0, 2.5, 5.0, 7.5, 10.0)

diagram(numbers).render("numbers")

Now if you think about a point in 2D space, it’s just two numbers joined together:
val point = Point(0, 10)
// point: Point = Point(x = 0.0, y = 10.0)

diagram(point).render("point")

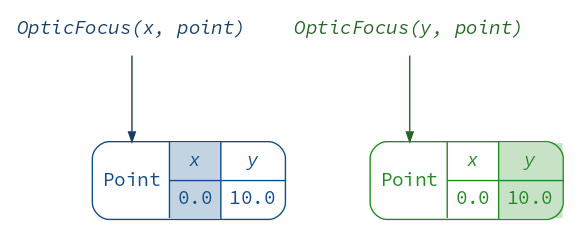
Can we use the number interpolation to interpolate these two numbers? To answer this question, let’s introduce more abstraction (in a great tradition of functional programming).
A lens Lens[A, B] is something that can “focus” on a piece of data of type B
inside a data structure of type A and provide read-write access to it.
We will use the excellent Monocle library
to create lenses and other optics along the way:
import monocle.macros.GenLens

val x = GenLens[Point](_.x)
// x: monocle.package.Lens[Point, Double] = repl.MdocSession$MdocApp$$anon$1@12712145
val y = GenLens[Point](_.y)
// y: monocle.package.Lens[Point, Double] = repl.MdocSession$MdocApp$$anon$2@4ca0f79d

(diagram(OpticFocus(x, point)).toNamespace("x") +
  diagram(OpticFocus(y, point)).toNamespace("y")).render("x+y")
Lenses provide several methods to manipulate data:
x.get(point)
// res10: Double = 0.0
y.set(20)(point)
// res11: Point = Point(x = 0.0, y = 20.0)
y.modify(_ + 20)(point)
// res12: Point = Point(x = 0.0, y = 30.0)
If we can read and write each coordinate field, we can interpolate them separately
and update the point field by field.
We do this by piping Interpolation.double through x and y lenses
and combining the resulting interpolations:
val pointInterpolation = (
  x.interpolateWith(Interpolation.double) +
  y.interpolateWith(Interpolation.double))
// pointInterpolation: Interpolation[Point] = reftree.geometry.Interpolation$$anonfun$apply$4@aa18576

val points = pointInterpolation.sample(Point(0, 0), Point(10, 20), 5).toList
// points: List[Point] = List(
//   Point(x = 0.0, y = 0.0),
//   Point(x = 2.5, y = 5.0),
//   Point(x = 5.0, y = 10.0),
//   Point(x = 7.5, y = 15.0),
//   Point(x = 10.0, y = 20.0)
// )

diagram(points).render("points")
Of course, reftree already defines this as Point.interpolation.
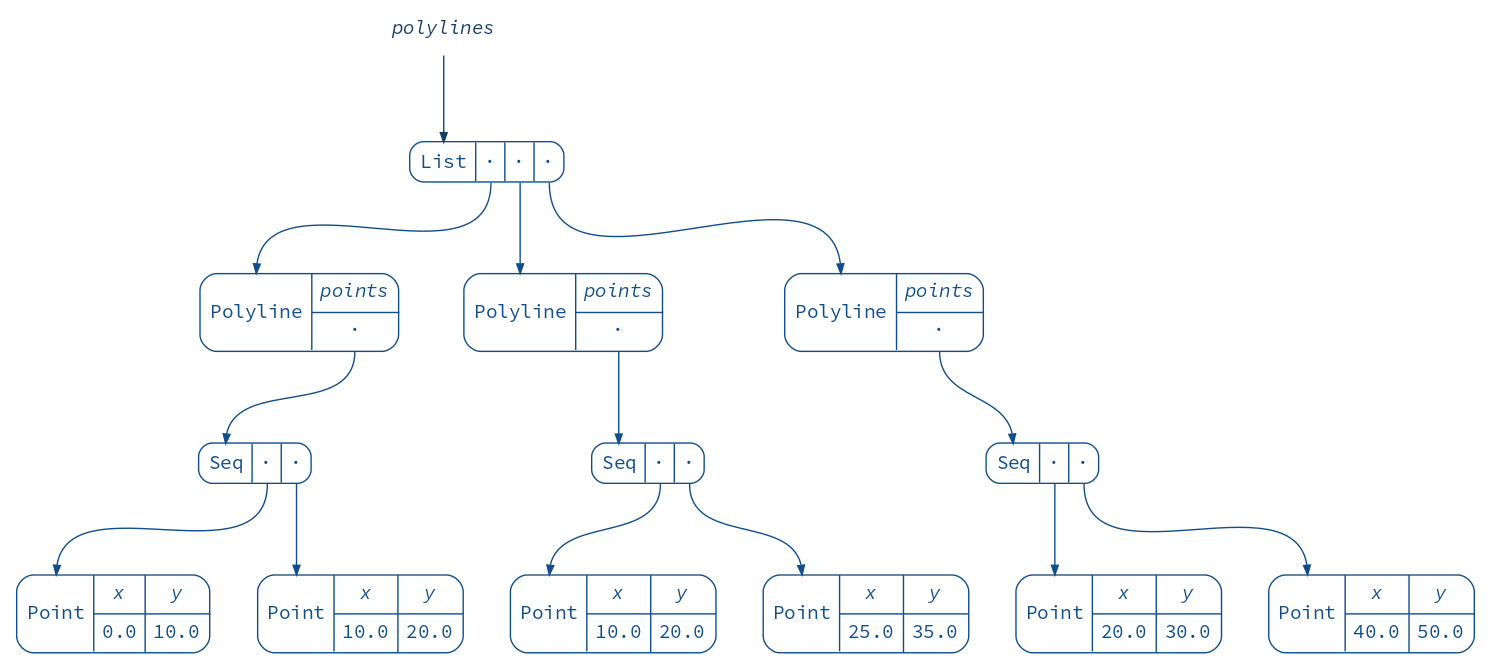
Using the same approach, we can build a polyline interpolator (assuming the polylines being interpolated consist of equal number of points):
Data.polyline1
// res14: Polyline = Polyline(
//   points = List(Point(x = 0.0, y = 10.0), Point(x = 10.0, y = 20.0))
// )
Data.polyline2
// res15: Polyline = Polyline(
//   points = List(Point(x = 20.0, y = 30.0), Point(x = 40.0, y = 50.0))
// )

val polylineInterpolation = (GenLens[Polyline](_.points)
  .interpolateEachWith(Point.interpolation))
// polylineInterpolation: Interpolation[Polyline] = reftree.geometry.Interpolation$$anonfun$apply$4@75fa97f4

val polylines = polylineInterpolation.sample(Data.polyline1, Data.polyline2, 3).toList
// polylines: List[Polyline] = List(
//   Polyline(points = List(Point(x = 0.0, y = 10.0), Point(x = 10.0, y = 20.0))),
//   Polyline(points = List(Point(x = 10.0, y = 20.0), Point(x = 25.0, y = 35.0))),
//   Polyline(points = List(Point(x = 20.0, y = 30.0), Point(x = 40.0, y = 50.0)))
// )

diagram(polylines).render("polylines")
We are finally ready to implement our first substantial interpolator: one that morphs graph edges.
The following approach is inspired by Mike Bostock’s path tween,
however reftree puts more emphasis on types and even includes its own
SVG path parser and simplification algorithm.
The resulting animation should look like this:

An edge is drawn with an SVG path, which consists of several commands, e.g. “move to”, “line to”, “bezier curve to”. Here is a minimized SVG snippet for an actual edge:
Data.edge1
// res17: xml.Node = <svg viewBox="50 -200 130 70" height="70pt" width="130pt" shape-rendering="geometricPrecision" xmlns="http://www.w3.org/2000/svg" xmlns:xlink="http://www.w3.org/1999/xlink"><g class="edge"><path d="M84.5,-195C84.5,-165.869 62.5907,-160.925 58.9962,-135.762" stroke="#104e8b" fill="none"/></g></svg>

diagram(Data.edge1).render("edge")
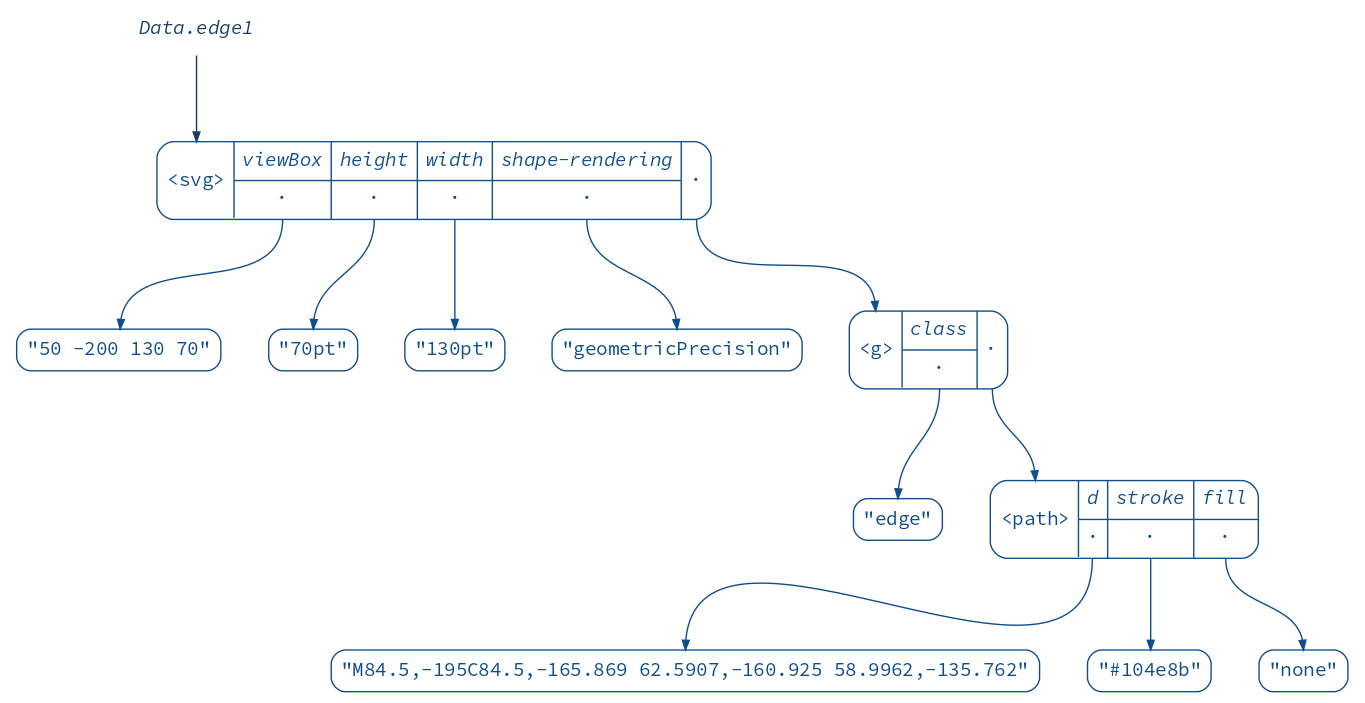
As you can see, the commands themselves are given in the d attribute inside the path element
in a rather obscure format. Luckily, we have lenses and other optics at our disposal
to plumb through this mess.
First, let’s get to the path element. reftree implements a few things that will help us:
XmlSvgApi, an implementation of several useful SVG operations for scala-xml. In particular, if offers a CSS selector-like method for matching elements of certain type and/or class.- An optic that focuses on an element deep inside XML or any other recursive data structure:
Optics.collectFirst. It is actually anOptional, not aLens, since the element might be missing.
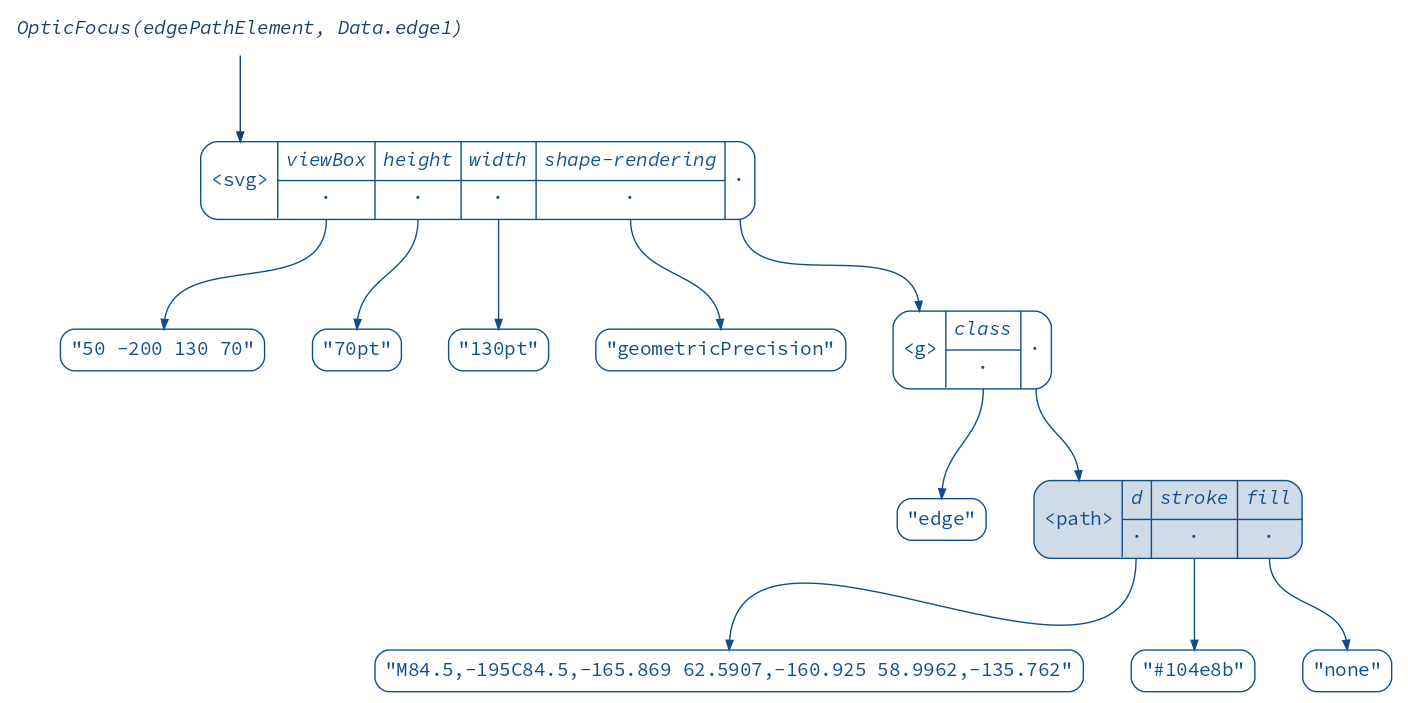
val edgePathElement = Optics.collectFirst(XmlSvgApi.select("path"))
// edgePathElement: monocle.package.Optional[xml.Node, xml.Node] = monocle.Optional$$anon$6@6e9afb07

diagram(OpticFocus(edgePathElement, Data.edge1)).render("edgePathElement")
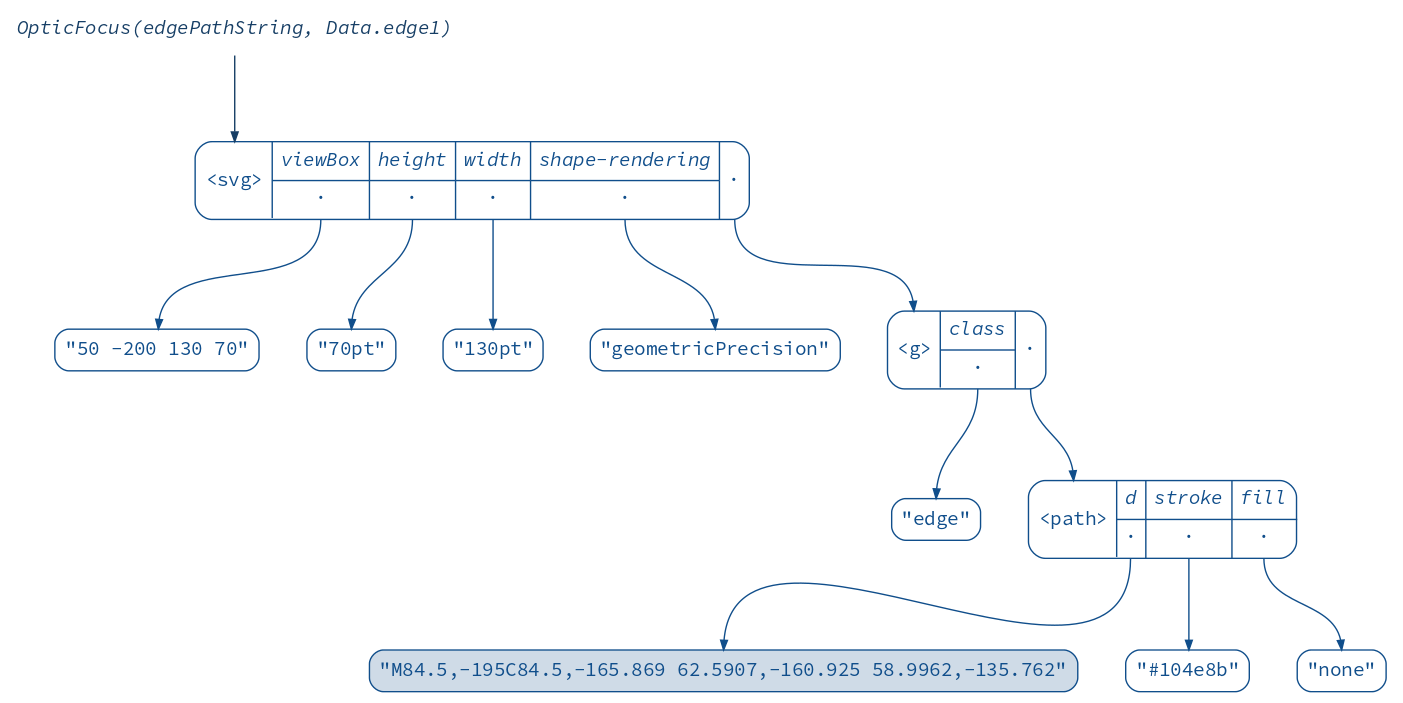
Next, we need to “descend” to the d attribute. Here is where optics really shine:
we can compose Optional[A, B] with Optional[B, C] to get an Optional[A, C]:
val d = XmlSvgApi.attr("d")
// d: monocle.package.Optional[xml.Node, String] = monocle.POptional$$anon$1@25cde556
val edgePathString = edgePathElement composeOptional d
// edgePathString: monocle.POptional[xml.Node, xml.Node, String, String] = monocle.POptional$$anon$1@23c14eac

diagram(OpticFocus(edgePathString, Data.edge1)).render("edgePathString")
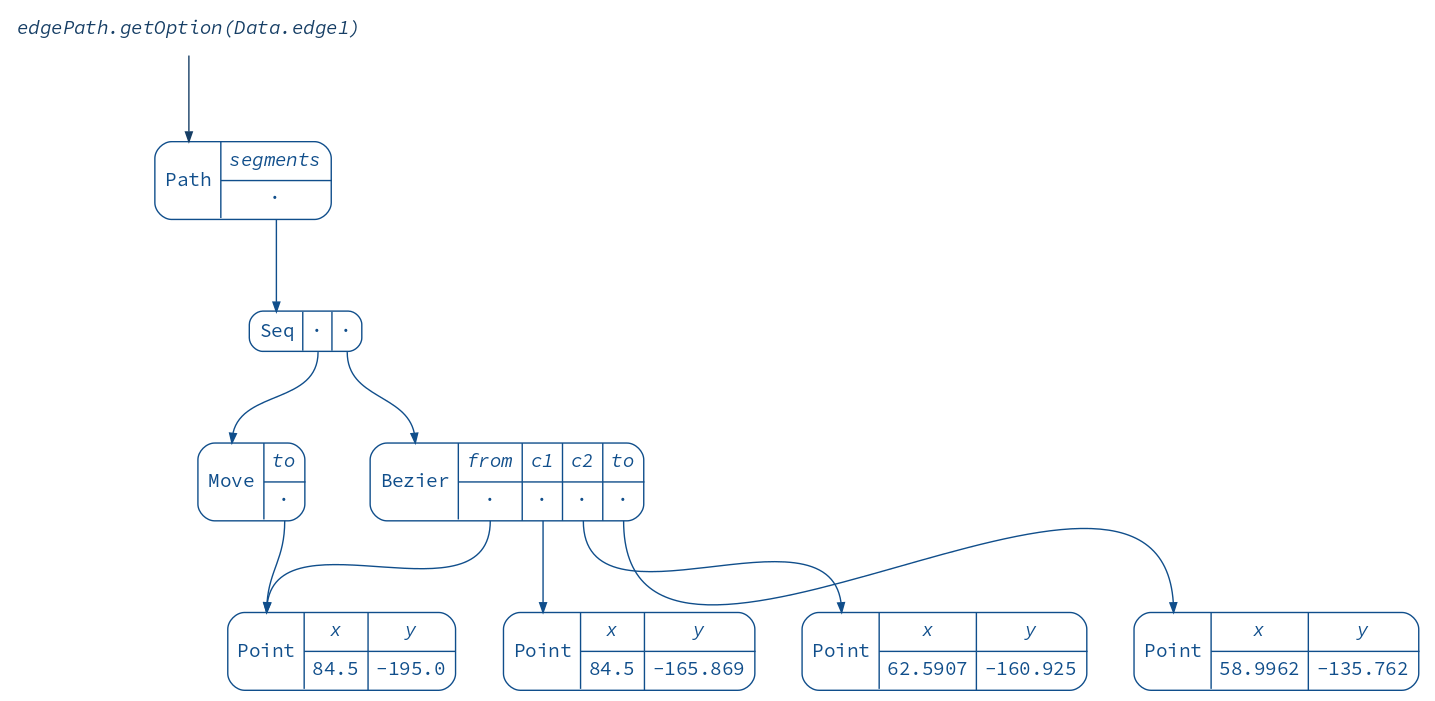
Next, we will use an isomorphism, another kind of optic, to view the string as a nice case class:
Path.stringIso
// res21: monocle.package.Iso[String, Path] = monocle.PIso$$anon$9@2a53817

val edgePath = edgePathString composeIso Path.stringIso
// edgePath: monocle.POptional[xml.Node, xml.Node, Path, Path] = monocle.POptional$$anon$1@3bdeb987

diagram(edgePath.getOption(Data.edge1)).render("edgePath")
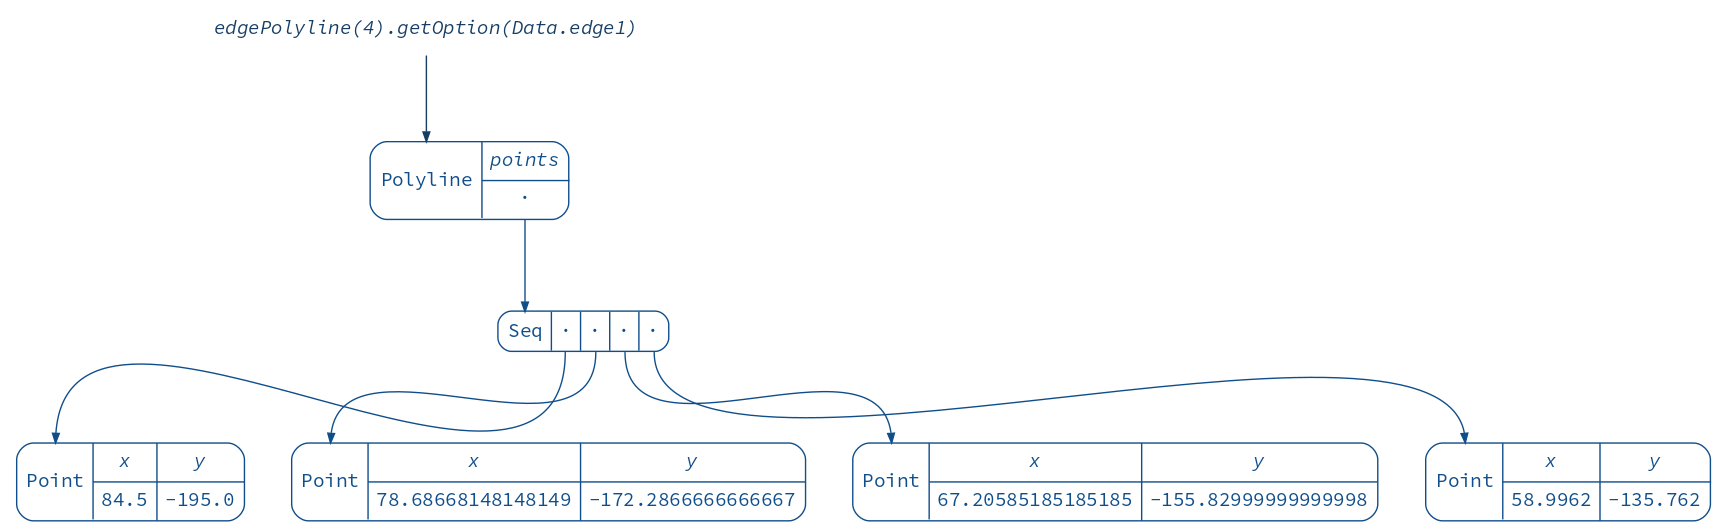
And finally, another isomorphism takes us from a Path to its sampled representation
as a Polyline. (Purists will say that this is not really an isomorphism because
it’s not reversible, but with a lot of points you can get pretty close ;))
Path.polylineIso(points = 4)
// res23: monocle.package.Iso[Path, Polyline] = monocle.PIso$$anon$9@71f30cff

def edgePolyline(points: Int) = edgePath composeIso Path.polylineIso(points)

diagram(edgePolyline(4).getOption(Data.edge1)).render("edgePolyline")
Let’s interpolate!
def edgeInterpolation(points: Int) = edgePolyline(points).interpolateWith(Polyline.interpolation)

def edges(points: Int, frames: Int) = (Data.edge1 +:
  edgeInterpolation(points).sample(Data.edge1, Data.edge2, frames, inclusive = false) :+
  Data.edge2)

AnimatedGifRenderer.renderFrames(
  edges(4, 4).map(Frame(_)),
  Paths.get(ImagePath, "visualize", "edges-4.gif"),
  RenderingOptions(density = 200),
  AnimationOptions(framesPerSecond = 1)
)

AnimatedGifRenderer.renderFrames(
  edges(100, 32).map(Frame(_)),
  Paths.get(ImagePath, "visualize", "edges-100.gif"),
  RenderingOptions(density = 200),
  AnimationOptions(framesPerSecond = 8)
)
With 4 points and 4 frames:

With 100 points and 32 frames:
Interpolating the entire image is left as an exercise for the reader, although the impatient will find the complete implementation here.
Notice that we never touched XML directly.
In fact, equipped with the same set of optics for another format or representation,
we would be able to operate on it without changing the code too much.
Case in point: reftree supports both
scala-xml and
scala-js-dom (for Scala.js),
with only 50 lines of implementation-specific code for each backend.
This goes to show the flexibility and usefulness of optics.
Zipping it up
In the previous section we saw Optics.collectFirst — an optic that is able to perform
modifications deep inside SVG. How do we go about implementing something like this,
or, more generally, how do we edit recursive data structures such as XML?
This solution is called a “Zipper”, and was introduced by Gérard Huet in 1997.
It consists of a “cursor” pointing to a location anywhere in a tree — “current focus”.
The cursor can be moved freely with operations like moveDownLeft, moveRight, moveUp, etc.
Current focus can be updated, deleted, or new nodes can be inserted to its left or right.
Zippers are immutable, and every operation returns a new Zipper.
All the changes made to the tree can be committed, yielding a new modified version of the original tree.
My zipper library
provides a few useful movements and operations. Just like optics, it’s rather generic and flexible.
The zipper can operate on any type, as long as an instance of the Unzip typeclass is available,
which can be automatically derived in many cases.
(Note that the derivation of Unzip for SVG can be found
here.)
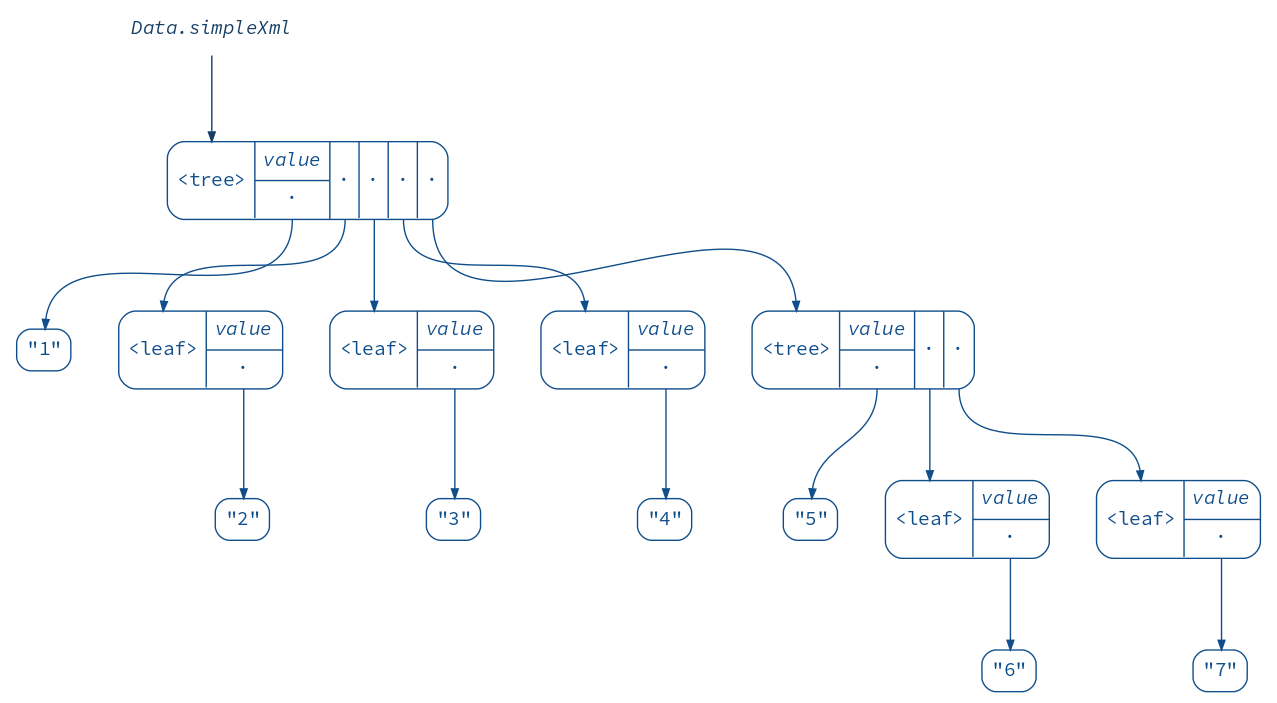
Consider a simple XML tree:
Data.simpleXml
// res27: xml.Node = <tree value="1"><leaf value="2"/><leaf value="3"/><leaf value="4"/><tree value="5"><leaf value="6"/><leaf value="7"/></tree></tree>

diagram(Data.simpleXml).render("simpleXml")
When we wrap a Zipper around this tree, it does not look very interesting yet:
import zipper.Zipper

val zipper1 = Zipper(Data.simpleXml)
// zipper1: Zipper[xml.Node] = Zipper(List(),<tree value="1"><leaf value="2"/><leaf value="3"/><leaf value="4"/><tree value="5"><leaf value="6"/><leaf value="7"/></tree></tree>,List(),None)

(diagram(Data.simpleXml) + diagram(zipper1)).render("zipper1")
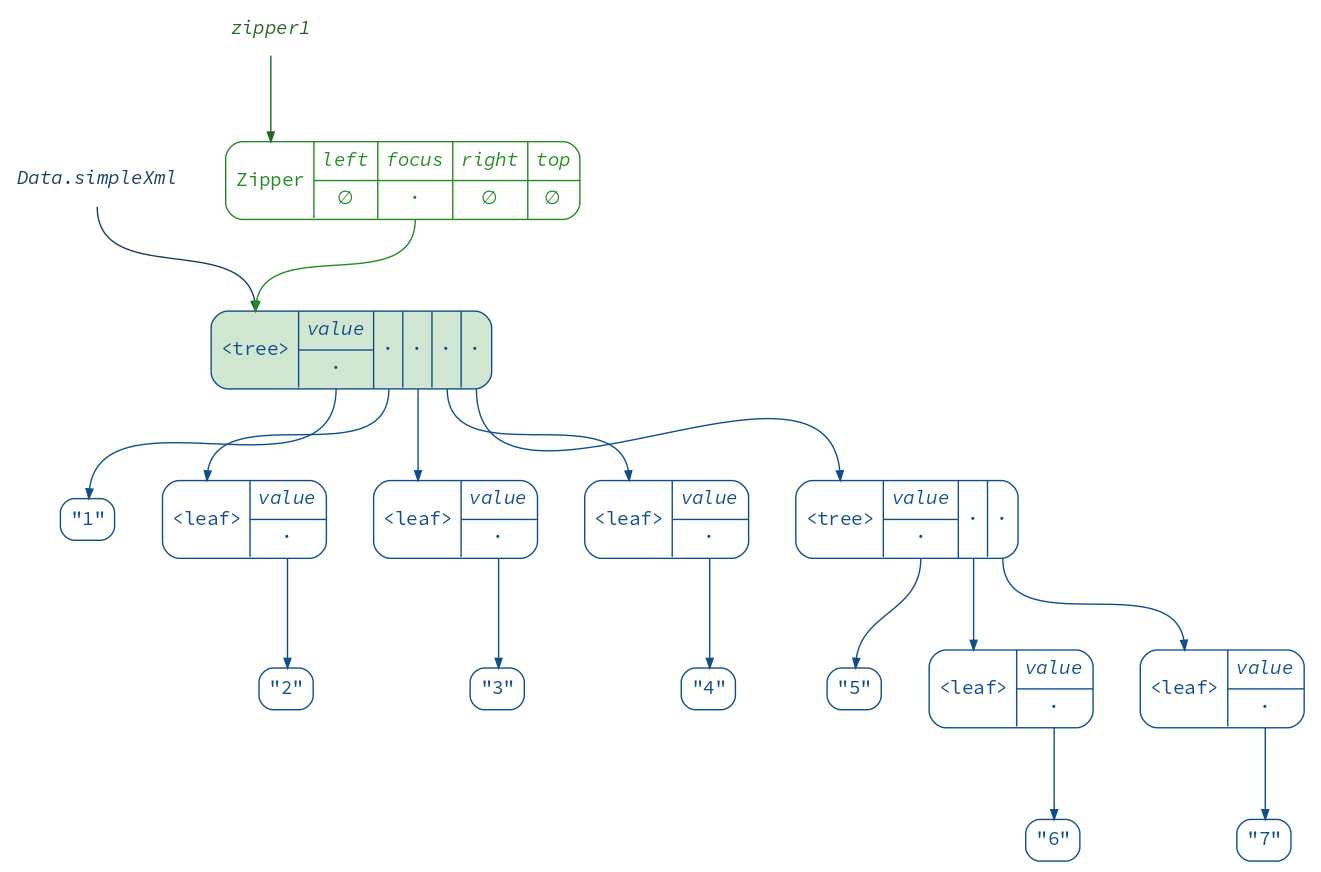
We can see that it just points to the original tree. In this case the focus is the root of the tree, which has no siblings, and the parent zipper does not exist, since we are at the top level.
To move down the tree, we “unzip” it, separating the child nodes into the focused node and its left and right siblings:
val zipper2 = zipper1.moveDownLeft
// zipper2: Zipper[xml.Node] = Zipper(List(),<leaf value="2"/>,List(<leaf value="3"/>, <leaf value="4"/>, <tree value="5"><leaf value="6"/><leaf value="7"/></tree>),Some(Zipper(List(),<tree value="1"><leaf value="2"/><leaf value="3"/><leaf value="4"/><tree value="5"><leaf value="6"/><leaf value="7"/></tree></tree>,List(),None)))

(diagram(zipper1) + diagram(zipper2)).render("zipper1+2")
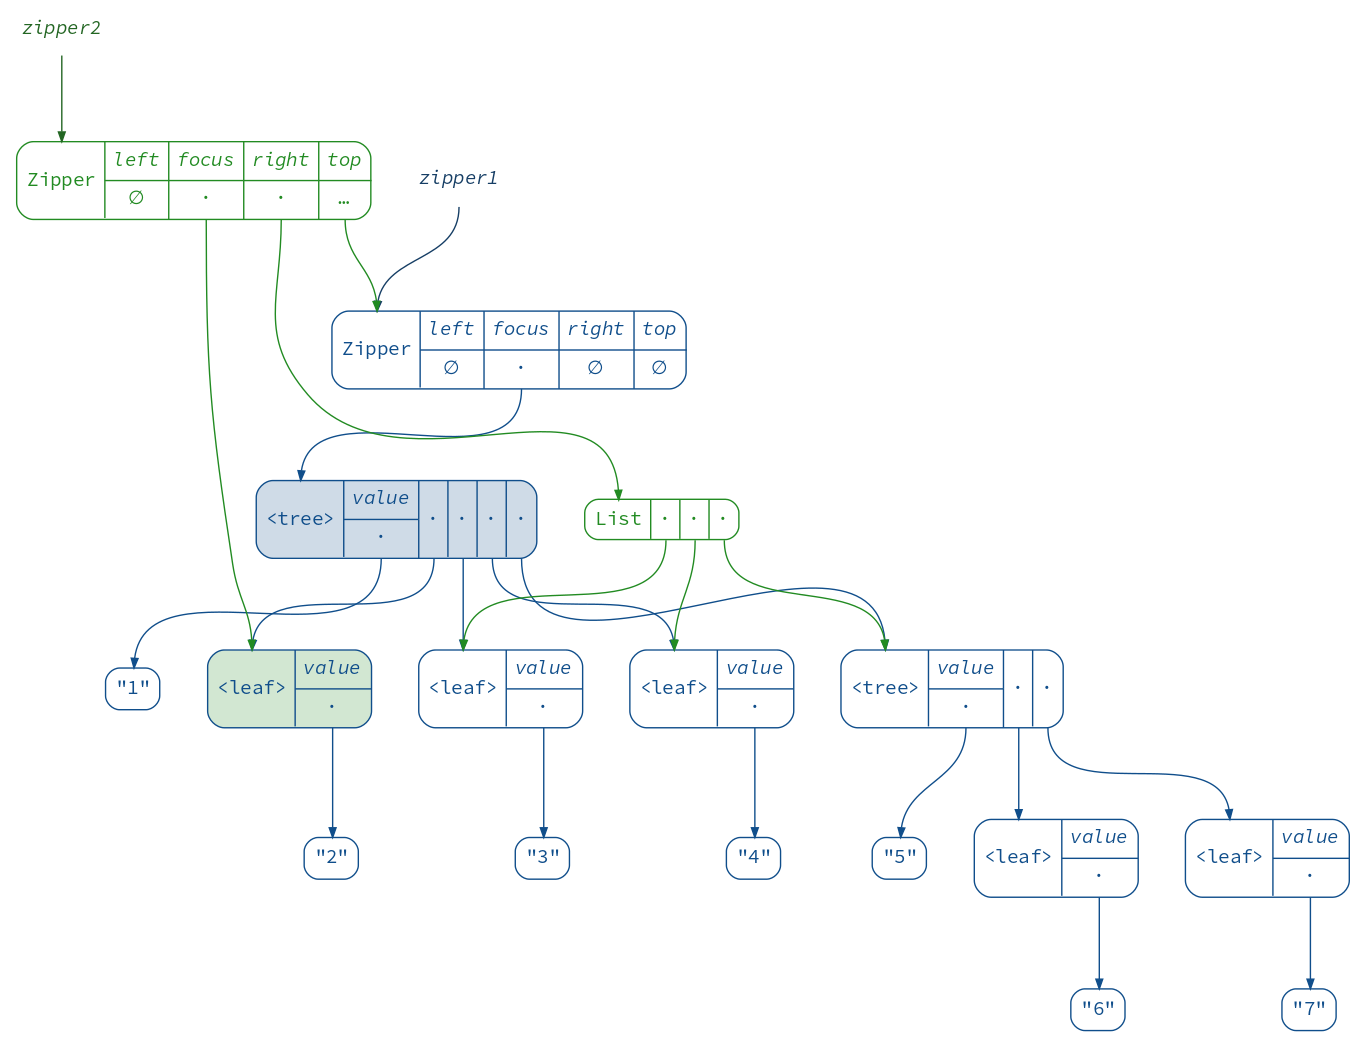
The new Zipper links to the old one, which will allow us to return to the root of the tree when we are done applying changes. This link however prevents us from seeing the picture clearly. Let’s look at the second zipper alone:
diagram(zipper2).render("zipper2b")
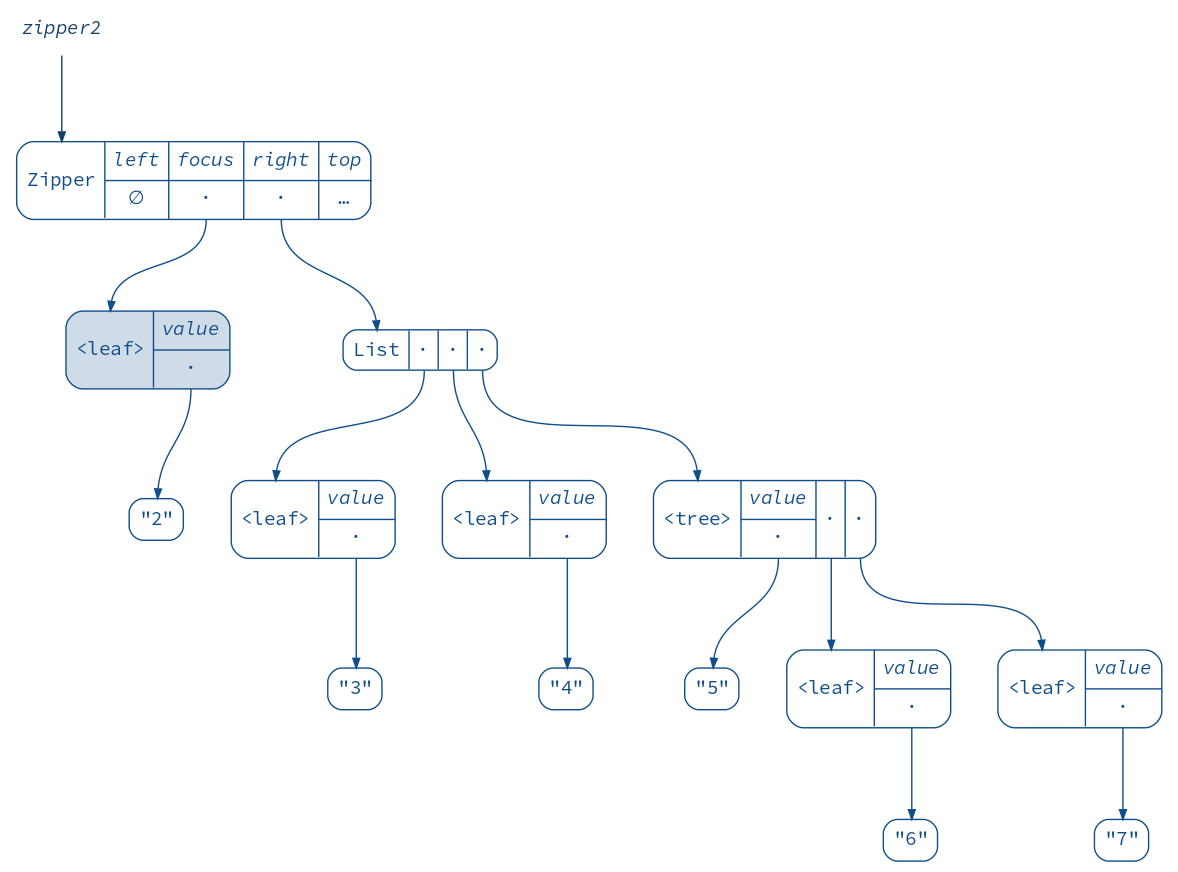
Great! We have 2 in focus and 3, 4, 5 as right siblings. What happens if we move right a bit?
val zipper3 = zipper2.moveRightBy(2)
// zipper3: Zipper[xml.Node] = Zipper(List(<leaf value="3"/>, <leaf value="2"/>),<leaf value="4"/>,List(<tree value="5"><leaf value="6"/><leaf value="7"/></tree>),Some(Zipper(List(),<tree value="1"><leaf value="2"/><leaf value="3"/><leaf value="4"/><tree value="5"><leaf value="6"/><leaf value="7"/></tree></tree>,List(),None)))

diagram(zipper3).render("zipper3")
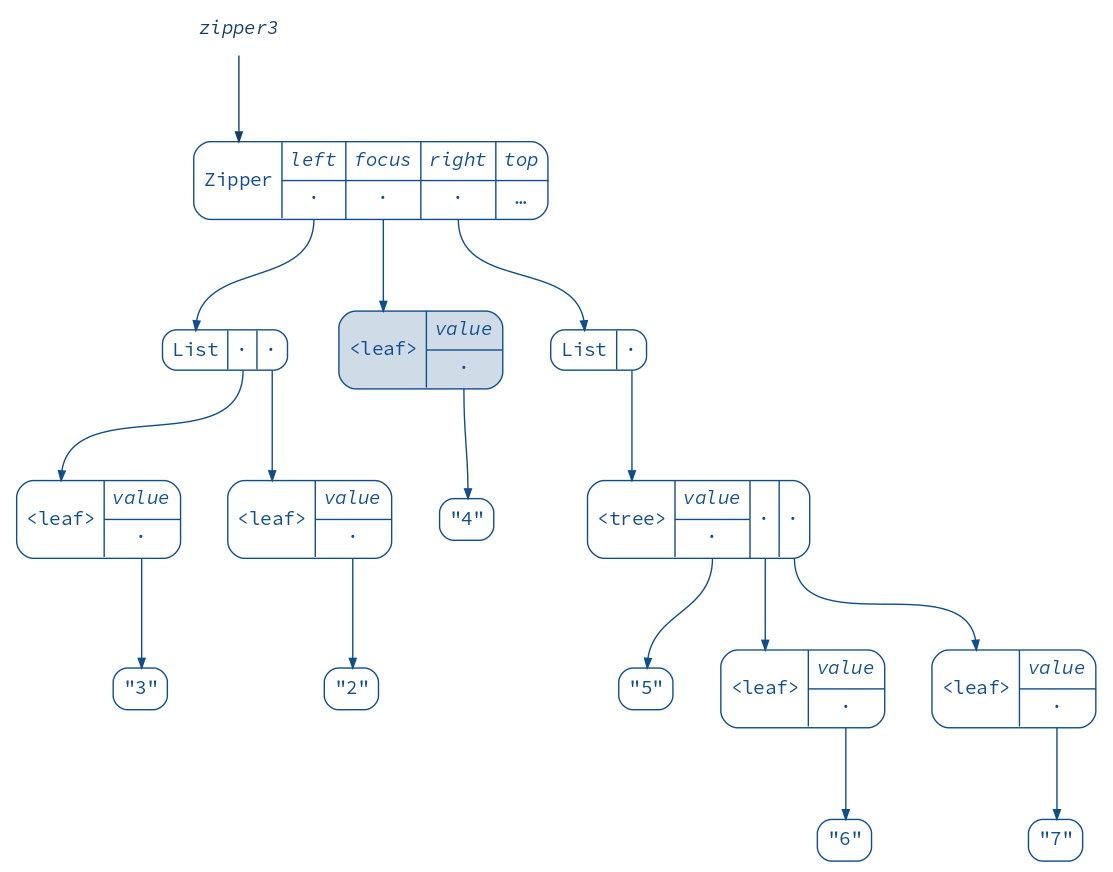
This is interesting! Notice that the left siblings are “inverted”. This allows to move left and right in constant time, because the sibling adjacent to the focus is always at the head of the list.
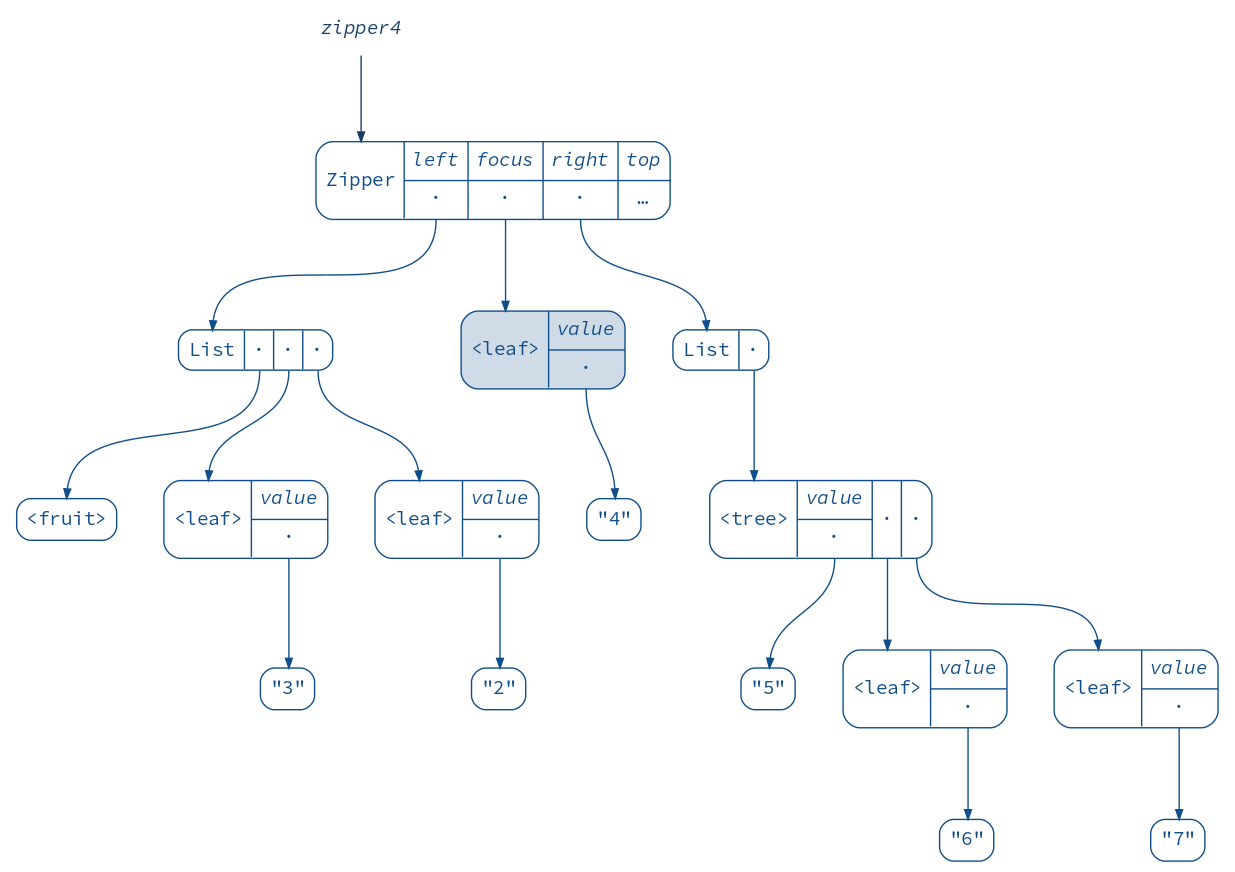
This also allows us to insert new siblings easily:
val zipper4 = zipper3.insertLeft(<fruit/>)
// zipper4: Zipper[xml.Node] = Zipper(List(<fruit/>, <leaf value="3"/>, <leaf value="2"/>),<leaf value="4"/>,List(<tree value="5"><leaf value="6"/><leaf value="7"/></tree>),Some(Zipper(List(),<tree value="1"><leaf value="2"/><leaf value="3"/><leaf value="4"/><tree value="5"><leaf value="6"/><leaf value="7"/></tree></tree>,List(),None)))

diagram(zipper4).render("zipper4")
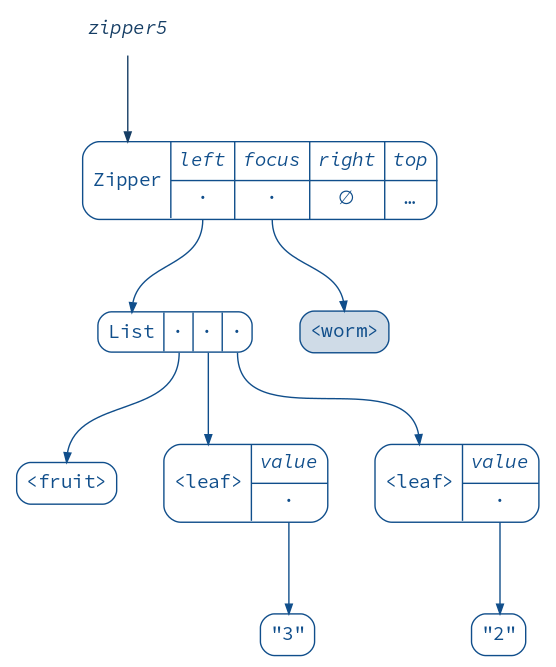
And, as you might know, we can delete nodes and update the focus:
val zipper5 = zipper4.deleteAndMoveRight.set(<worm/>)
// zipper5: Zipper[xml.Node] = Zipper(List(<fruit/>, <leaf value="3"/>, <leaf value="2"/>),<worm/>,List(),Some(Zipper(List(),<tree value="1"><leaf value="2"/><leaf value="3"/><leaf value="4"/><tree value="5"><leaf value="6"/><leaf value="7"/></tree></tree>,List(),None)))

diagram(zipper5).render("zipper5")
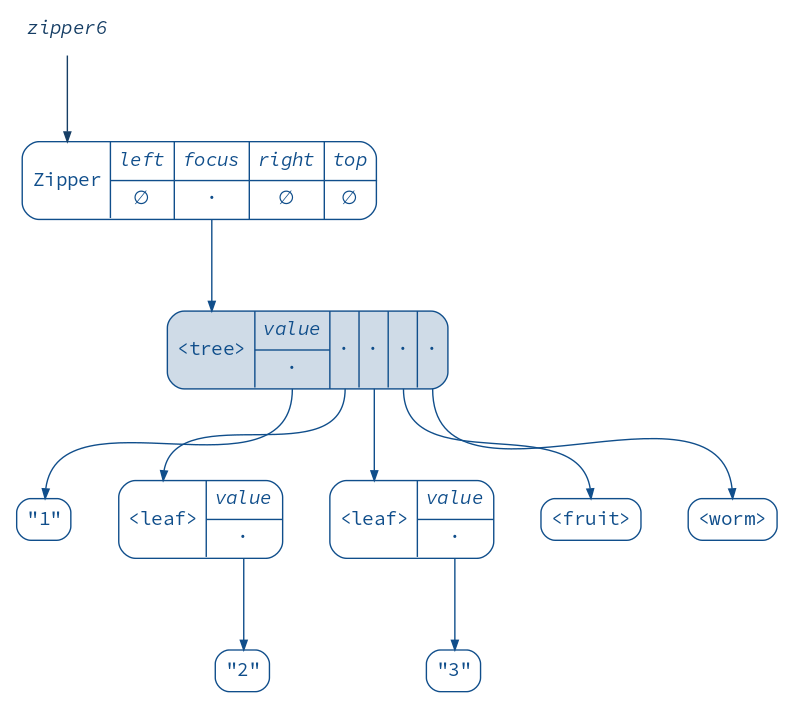
Finally, when we move up, the siblings at the current level are “zipped” together and their parent node is updated:
val zipper6 = zipper5.moveUp
// zipper6: Zipper[xml.Node] = Zipper(List(),<tree value="1"><leaf value="2"/><leaf value="3"/><fruit/><worm/></tree>,List(),None)

diagram(zipper6).render("zipper6")
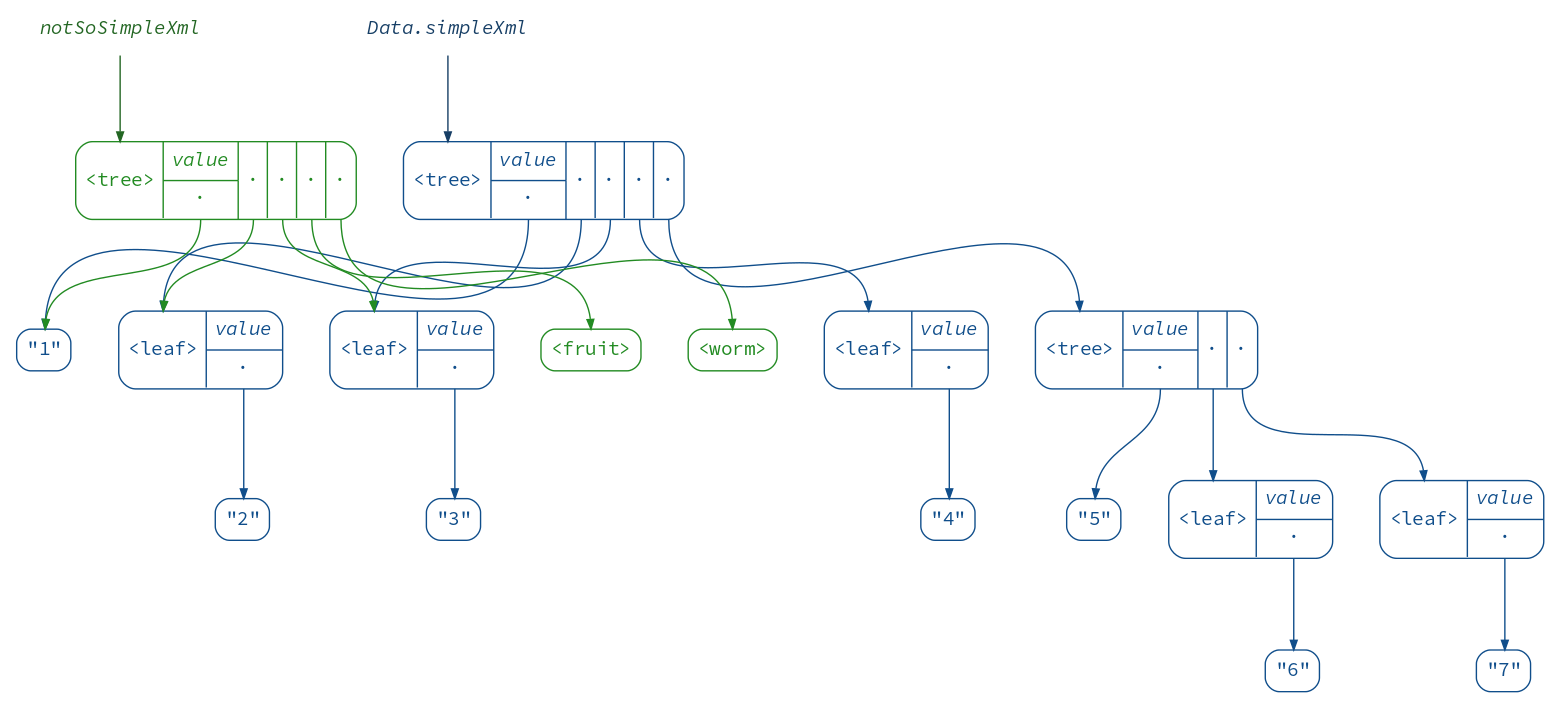
When we are done editing, the .commit shorthand can be used for going
all the way up (applying all the changes) and returning the focus.
Notice how all the unchanged nodes are shared between the old and the new XML.
val notSoSimpleXml = zipper6.commit
// notSoSimpleXml: xml.Node = <tree value="1"><leaf value="2"/><leaf value="3"/><fruit/><worm/></tree>

(diagram(Data.simpleXml) + diagram(notSoSimpleXml)).render("notSoSimpleXml")
Using an XML zipper, a determined reader can easily implement advanced lenses,
such as Optics.collectFirst, Optics.collectLeftByKey, etc, all found
here.
To conclude, here is an animation of a zipper and the tree it operates on (from my previous talk), produced (as we know now) not without zippers’ help:
That’s all! Thank you for reading this far.
I hope you are leaving this page with some great reftree use-cases in mind :)